Climate declaration follow-up and statistics
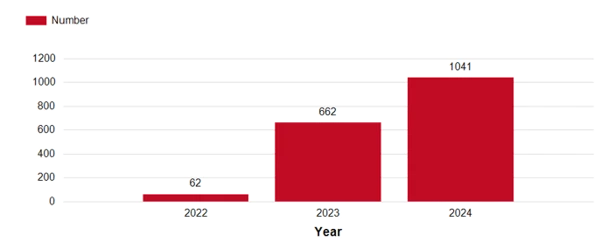
During the period 2022–2024, a total of 1765 climate declarations have been registered at Boverket – the Swedish National Board of Housing, Building and Planning. You can read here about current follow-up and statistics on climate declarations for buildings in Sweden. The statistics are under development and will be updated annually.
Data
Follow-up and statistics are based on data from the climate declaration register at Boverket, oversight of registered climate declarations and follow-ups in municipalities up until 31 December 2024.
Number of registered climate declarations

A total of 1765 climate declarations have been received by Boverket since the regulations on climate declarations for new buildings entered into force on 1 January 2022. The requirement to register a climate declaration applies to buildings for which a building permit was applied for after 1 January 2022. As the construction process for erecting a building takes time from the moment of applying for a building permit to submitting a climate declaration before final approval, the low number of climate declarations registered in 2022 is justifiable.
Number of climate declarations per county
| County | Number |
| Blekinge län | 14 |
| Dalarnas län | 66 |
| Gotlands län | 4 |
| Gävleborgs län | 22 |
| Hallands län | 119 |
| Jämtlands län | 38 |
| Jönköpings län | 72 |
| Kalmar län | 54 |
| Kronobergs län | 27 |
| Norrbottens län | 46 |
| Skåne län | 214 |
| Stockholms län | 403 |
| Södermanlands län | 29 |
| Uppsala län | 89 |
| Värmlands län | 84 |
| Västerbottens län | 31 |
| Västernorrlands län | 24 |
| Västmanlands län | 75 |
| Västra Götalands län | 199 |
| Örebro län | 43 |
| Östergötlands län | 112 |
| Total | 1765 |
The number of climate declarations registered per county varies from 4 to 403, a relatively wide distribution, as illustrated in the table and map above. One explanation for the relatively low number of climate declarations in certain counties is that less buildings are being constructed for reasons such as a small population. On the other hand, the larger number of climate declarations in certain counties could be attributed to the increased need to build more during a period of regional growth. Another reason for the distribution of climate declarations between counties might be differences in how long the building process takes from one place to another, including how long it takes to obtain a building permit.
Number of climate declarations by building type and year

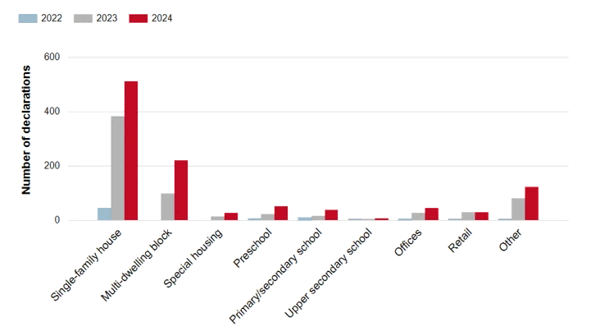
Most of the 1765 climate declarations registered at Boverket are for single-family houses. Buildings that take less time to complete are likely to be overrepresented in the statistics, as only those buildings for which a building permit was applied for after the law on climate declarations came into effect are included. Examples of building types with shorter completion times include single-family houses and modular buildings.
When a climate declaration is registered for a mixed-use building, the building type is determined based on the building use whose gross floor area (GFA) was predominant in the building.
Climate impact per building type, median

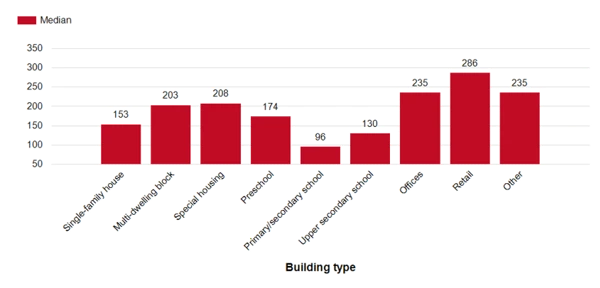
The diagram above shows median climate impact in kg CO2e/m2 GFA by building type. The median value varies from 96 to 286 kg CO2e/m² GFA. For certain building types, the median value is based on very few climate declarations. For example, only 3 climate declarations were registered for the building type “Upper secondary school”. In the category “primary and secondary school”, there are several buildings where reused modular buildings have been used, which can explain the relatively low median value for climate impact reported in the diagram above.
Median values are based on the climate impact reported from the climate declaration submitted to Boverket. To compare the median value with values in the reports issued by Boverket and the Royal Institute of Technology (KTH) one should consider the system boundaries. To avoid misleading comparisons, it is important to consider which aspects of the building’s lifecycle have been included or excluded.
The assignment on limit values
You find the report Limit values for climate impact from buildings and an expanded climate declaration from Boverket in Relaterad information.
Supervision of climate declarations
Boverket is the supervisory authority tasked to control the quality and accuracy of climate declarations. Boverket verifies that the information in climate declarations is accurate and that the calculations of climate impact do not deviate significantly from the declared value. The table below shows statistics from Boverket’s supervision of climate declarations.
| Year | Number of supervisory cases | Supervisory cases as a percentage of registrations |
| 2023 | 81 | 11 % |
| 2024 | 101 | 9,7 % |
| Total | 182 | 10,3 % |
The table shows the number of climate declarations selected for control during the year 2023 and 2024, as well as the percentage of climate declarations registered at Boverket that were selected for control. Source: Boverket’s climate declaration register and register of supervisory cases.
In total, 182 climate declarations were selected for control between March 2023 and December 2024. These were registered during 2022 and 2024. Boverket has a total of 1765 climate declarations registered in the database. The climate declarations selected for control equate to 10,3 percent of all registered climate declarations. Controls have largely been based on random selection.
About our statistics
Statistics are collated from the climate declaration register at Boverket and from supervisory cases up to 31 December 2024. The statistics cover the years 2022 to 2024. The data has been processed to remove cancelled climate declarations from the statistics. Boverket is aware that a small number of buildings with a gross floor area under 100 m2 are included in the statistics despite being exempted from the climate declaration requirement. There are also climate declarations registered with Boverket that report unreasonably low or high climate impact. These climate declarations are the reason why the average value is not reported, but instead the median value has been chosen as it better reflects the average climate impact.
Was the information helpful?
We’re glad the information helped you! Tell us what you thought was good so we can get even better. Please note that you will not get a reply.
You can help us even more by filling out why you did not think the information was helpful. Please note that you will not get a reply.
